
모범 사례
Performance
First, use the
nvidia-smi -l 1command to check GPU utilization. If GPU utilization is 0%, check your code first to see if it is calling the GPU for computation. If GPU utilization is already at 90% or higher, consider switching to multi-GPU parallel processing or a GPU with higher computing power.
If you notice that training is significantly slow, you can first run the following code to perform a stress test to rule out hardware issues and monitor GPU utilization:
import torch
m = k = n = 8192
a = torch.zeros(m, k, dtype=torch.float32).cuda("cuda:0")
b = torch.zeros(k, n, dtype=torch.float32).cuda("cuda:0")
for _ in range(100):
    y = torch.matmul(a, b)
torch.cuda.synchronize("cuda:0")
Bottleneck Analysis
First, determine the characteristics of the model you are training. In terms of performance, it can be categorized into the following scenarios:
- Small models with simple data preprocessing. For example, training MNIST using LeNet. In this scenario, there is little room for optimization because the model itself has low computational requirements; it can be trained using a standard GPU, and using a higher-end GPU will result in lower utilization. In this scenario, GPU utilization typically remains at a relatively low level but with minimal fluctuations.
- Small models with complex data preprocessing.For example, when running ImageNet classification using a 18-layer ResNet network, CPU preprocessing takes significantly longer, while GPU computation is very fast and takes much less time. Therefore, it is advisable to use a higher-end CPU and a standard GPU. In this scenario, GPU utilization is characterized by high fluctuations, with high peaks followed by low levels for most of the time.
- Large models and simple data preprocessing. In this scenario, GPU utilization is generally high and stable, but disk requirements are also high. If utilization is low, please refer to the methods below to squeeze out more performance.
- Large models involve complex data preprocessing. In such cases, both CPU and GPU are heavily taxed and may become bottlenecks, including disk performance; analysis must be tailored to the specific algorithm.
For scenarios 1 and 2 above, there is limited room for optimization; it is more appropriate to focus on selecting the right host in conjunction with code optimization to improve cost-effectiveness. For scenarios 3 and 4, if you find that GPU utilization is low, you can troubleshoot bottlenecks and optimize performance using the methods described below.
If the GPU consistently shows zero utilization, please verify the following Ampere architecture cards: 3060, 3090, 3080 Ti, 4090, 4090D,A4000, A5000, A40, A100, A800, L20, H20, H800, and other Ampere-architecture cards require cuda11.x to function (preferably cuda11.1 or higher); please use a higher version of the framework.
Step 1: Check GPU Utilization
Execute the command nvidia-smi -l 1 in the terminal
user@seeta:/tmp/test_directory$ nvidia-smi -l 1
Mon Nov  8 11:55:26 2021
+-----------------------------------------------------------------------------+
| NVIDIA-SMI 440.82       Driver Version: 440.82       CUDA Version: 10.2     |
|-------------------------------+----------------------+----------------------+
| GPU  Name        Persistence-M| Bus-Id        Disp.A | Volatile Uncorr. ECC |
| Fan  Temp  Perf  Pwr:Usage/Cap|         Memory-Usage | GPU-Util  Compute M. |
|===============================+======================+======================|
|   0  TITAN X (Pascal)    Off  | 00000000:01:00.0  On |                  N/A |
| 31%   57C    P0    66W / 250W |    408MiB / 12194MiB |      2%      Default |
+-------------------------------+----------------------+----------------------+
|   1  TITAN X (Pascal)    Off  | 00000000:04:00.0 Off |                  N/A |
| 93%   27C    P8    11W / 250W |      2MiB / 12196MiB |      0%      Default |
+-------------------------------+----------------------+----------------------+

+-----------------------------------------------------------------------------+
| Processes:                                                       GPU Memory |
|  GPU       PID   Type   Process name                             Usage      |
|=============================================================================|
|    0      1450      G   /usr/lib/xorg/Xorg                            32MiB |
|    0      2804      G   /usr/lib/xorg/Xorg                           351MiB |
+-----------------------------------------------------------------------------+
If the GPU utilization is 0, it indicates that the code may not be using the GPU; you should check the code.
If GPU utilization fluctuates wildly and peak utilization remains below 50%, it may be because data preprocessing cannot keep up with the GPU’s processing speed. Please follow the steps below.
Step 2: Check CPU Usage
Please locate the "Instance Monitoring" button under Console > Container Instances.

View CPU usage:
- Assuming your instance has 5 cores, if CPU utilization approaches 500% (meaning all 5 cores are under heavy load), it is likely that the number of CPUs is insufficient and the CPU has become a bottleneck. In this case, you can migrate the instance to a host with more CPUs or upgrade your instance.If the CPU utilization is far below 500%, it indicates that your code is not fully utilizing the CPU’s computing power. You can generally increase CPU utilization by adjusting the
worker_numparameter in the Torch Dataloader. As a rule of thumb, setworker_numto slightly less than the number of cores; it is best to test how differentworker_numvalues affect performance.
Step 3: Review the Code
If none of the above steps resolve the issue, please debug the code to identify the lines causing the delay for further analysis. There are several common coding practices at the code level that can impact performance; please check your code for these:
- Perform some non-computational operations during each iteration, such as saving test images. The solution is to extend the interval between saving test images to avoid performing these time-consuming operations in every iteration.
- Frequent model saving causes the saving process to take up a significant portion of the training time.
- PyTorch’s official performance optimization guide: View
- TensorFlow’s official performance optimization guide: View
- We also welcome you to submit feedback on other cases and share your knowledge on the website.
Other
NumPy Version Issues
Preliminary troubleshooting: CPU utilization is extremely high, with all cores running at full capacity; even after upgrading to a system with more cores, the CPU continues to run at full capacity with ease, while GPU utilization remains consistently low. Furthermore, since an Intel CPU is being used, there is a high likelihood that the performance issue is caused by a NumPy version problem.
NumPy uses OpenBlas or MKL for computational acceleration. Intel CPUs support MKL, while AMD CPUs support only OpenBlas. If you are using an Intel CPU, MKL provides several times the performance of OpenBlas (for certain matrix computations), which has a significant impact on overall performance.Generally speaking, AMD CPUs running OpenBlas perform faster than Intel CPUs running OpenBlas; therefore, there is no need to be overly concerned about poor performance when using OpenBlas on AMD CPUs.
If you are using an Intel CPU, first verify whether you are using the MKL or OpenBLAS version of NumPy.
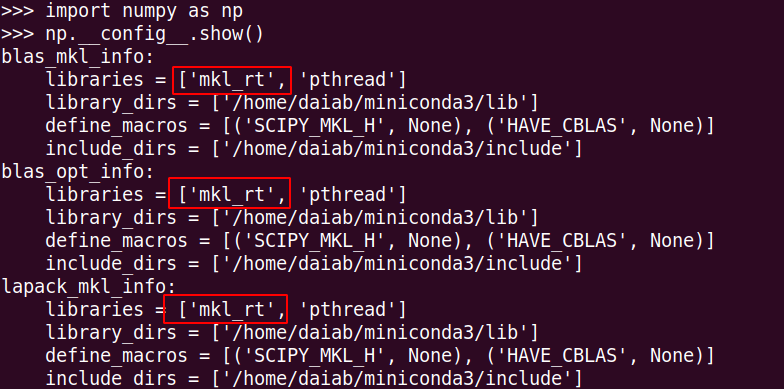
The presence of "mkl" indicates that it is an MKL version.
When using domestic Conda repositories such as Tsinghua’s, the installation of NumPy defaults to the OpenBLAS acceleration scheme. If you install it using conda install numpy, you will find the following OpenBLAS-related packages:
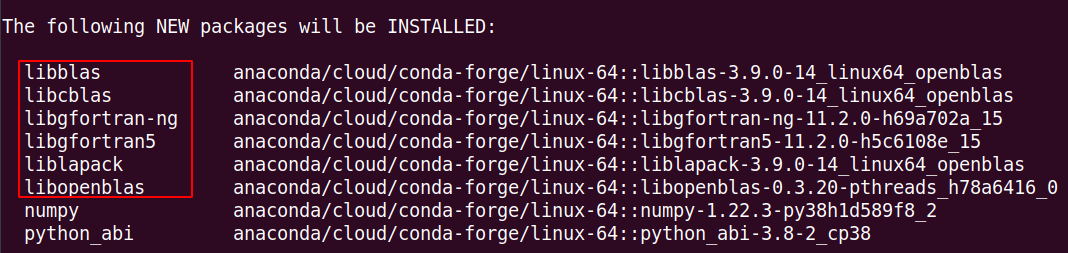
So, to install MKL’s NumPy, follow these steps:
# 第一步:卸载当前的NumPy
pip uninstall numpy (如果是conda安装的, conda uninstall numpy)
# 第二步:删除国内的Conda源
echo "" > /root/.condarc
# 第三步:重新安装NumPy
conda install numpy
If the above steps were performed correctly, you will see the following when installing NumPy:
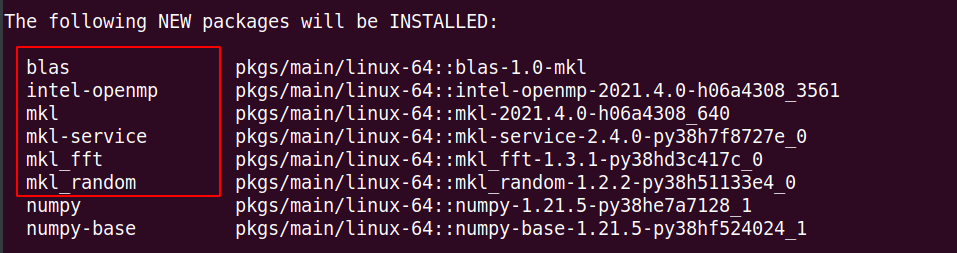
PyTorch Thread Count Issue
Preliminary troubleshooting: If you have rented a multi-GPU instance and each GPU is running a different experiment, this may be the cause of the issue.
By default, PyTorch creates a number of threads equal to the number of cores to perform computations.If you rent multiple GPUs on the same instance and run multiple experiments on different GPUs, each PyTorch process will, by default, create a number of threads equal to the number of cores. This causes the system to spend a significant amount of time on thread scheduling rather than computation, resulting in a substantial slowdown in computation speed and low utilization of both the CPU and GPU.In this case, you can use the code torch.set_num_threads(N) to set the number of threads started by a single process and resolve this issue.
More Experience
- If you are using multi-GPU parallel processing on a single machine with the PyTorch framework, replacing
torch.nn.DataParallel(DP) withtorch.nn.DistributedDataParallel(DDP) generally improves performance. The official source states:DistributedDataParallel offers much better performance and scaling to multiple-GPUs. - If you are using an NVIDIA GPU based on the Ampere architecture, such as the RTX 3090, the latest version of PyTorch 1.9 and 1.10 will offer significant performance improvements over version 1.7. PyTorch 1.7 and 1.8 perform poorly.(After shutting down, replace the PyTorch 1.10 image under “More Actions.”)
- When using the platform, if your algorithm is resource-intensive, it is best to launch multiple instances on different hosts when tuning parameters for multiple experiments simultaneously, running one experiment per instance. Avoid launching instances on the same host or renting multiple GPUs on the same instance; instead, run each experiment on a separate GPU.