
エンタープライズ機能
Performance Metrics Monitoring
Available only to enterprise-verified accounts
Method 1: Proactively Retrieve the API from Within the Container
Use the following code to retrieve CPU, memory, and GPU monitoring information within a container (either a container instance or a container in an elastic deployment):
import requests
import json

# url地址不同容器都一样,均使用127.0.0.1进行获取
url = 'http://127.0.0.1:2022/autopanel/v1/api/monitor/current'
response = requests.get(url)
content = response.content.decode()
if response.status_code == 200 and "success" in content:
    metric = json.loads(content)['data']
    print(f"CPU Usage: {metric['cpu_usage']} %")
    print(f"Mem Usage: {metric['memory_usage']} MiB")
    print("GPU Info:")
    gpu_metrics = metric.get('gpu_list', [])
    for gm in gpu_metrics:
        print(f"\tIdx:{gm['index']}  Mem Usage: {gm['memory_used']} MiB  Utilization: {gm['utilization']} %")
Method 2: Push to Prometheus
You can configure the PushGateway username and password for your own hosted Prometheus instance on WebCal. WebCal will automatically push container metric data to your private Prometheus database, allowing you to view monitoring data for all containers using other tools such as Grafana.Note: You are responsible for providing Prometheus, PushGateway, Grafana, and other components yourself; WebCal only pushes the data.
Configure and enable the push of monitoring data to Prometheus
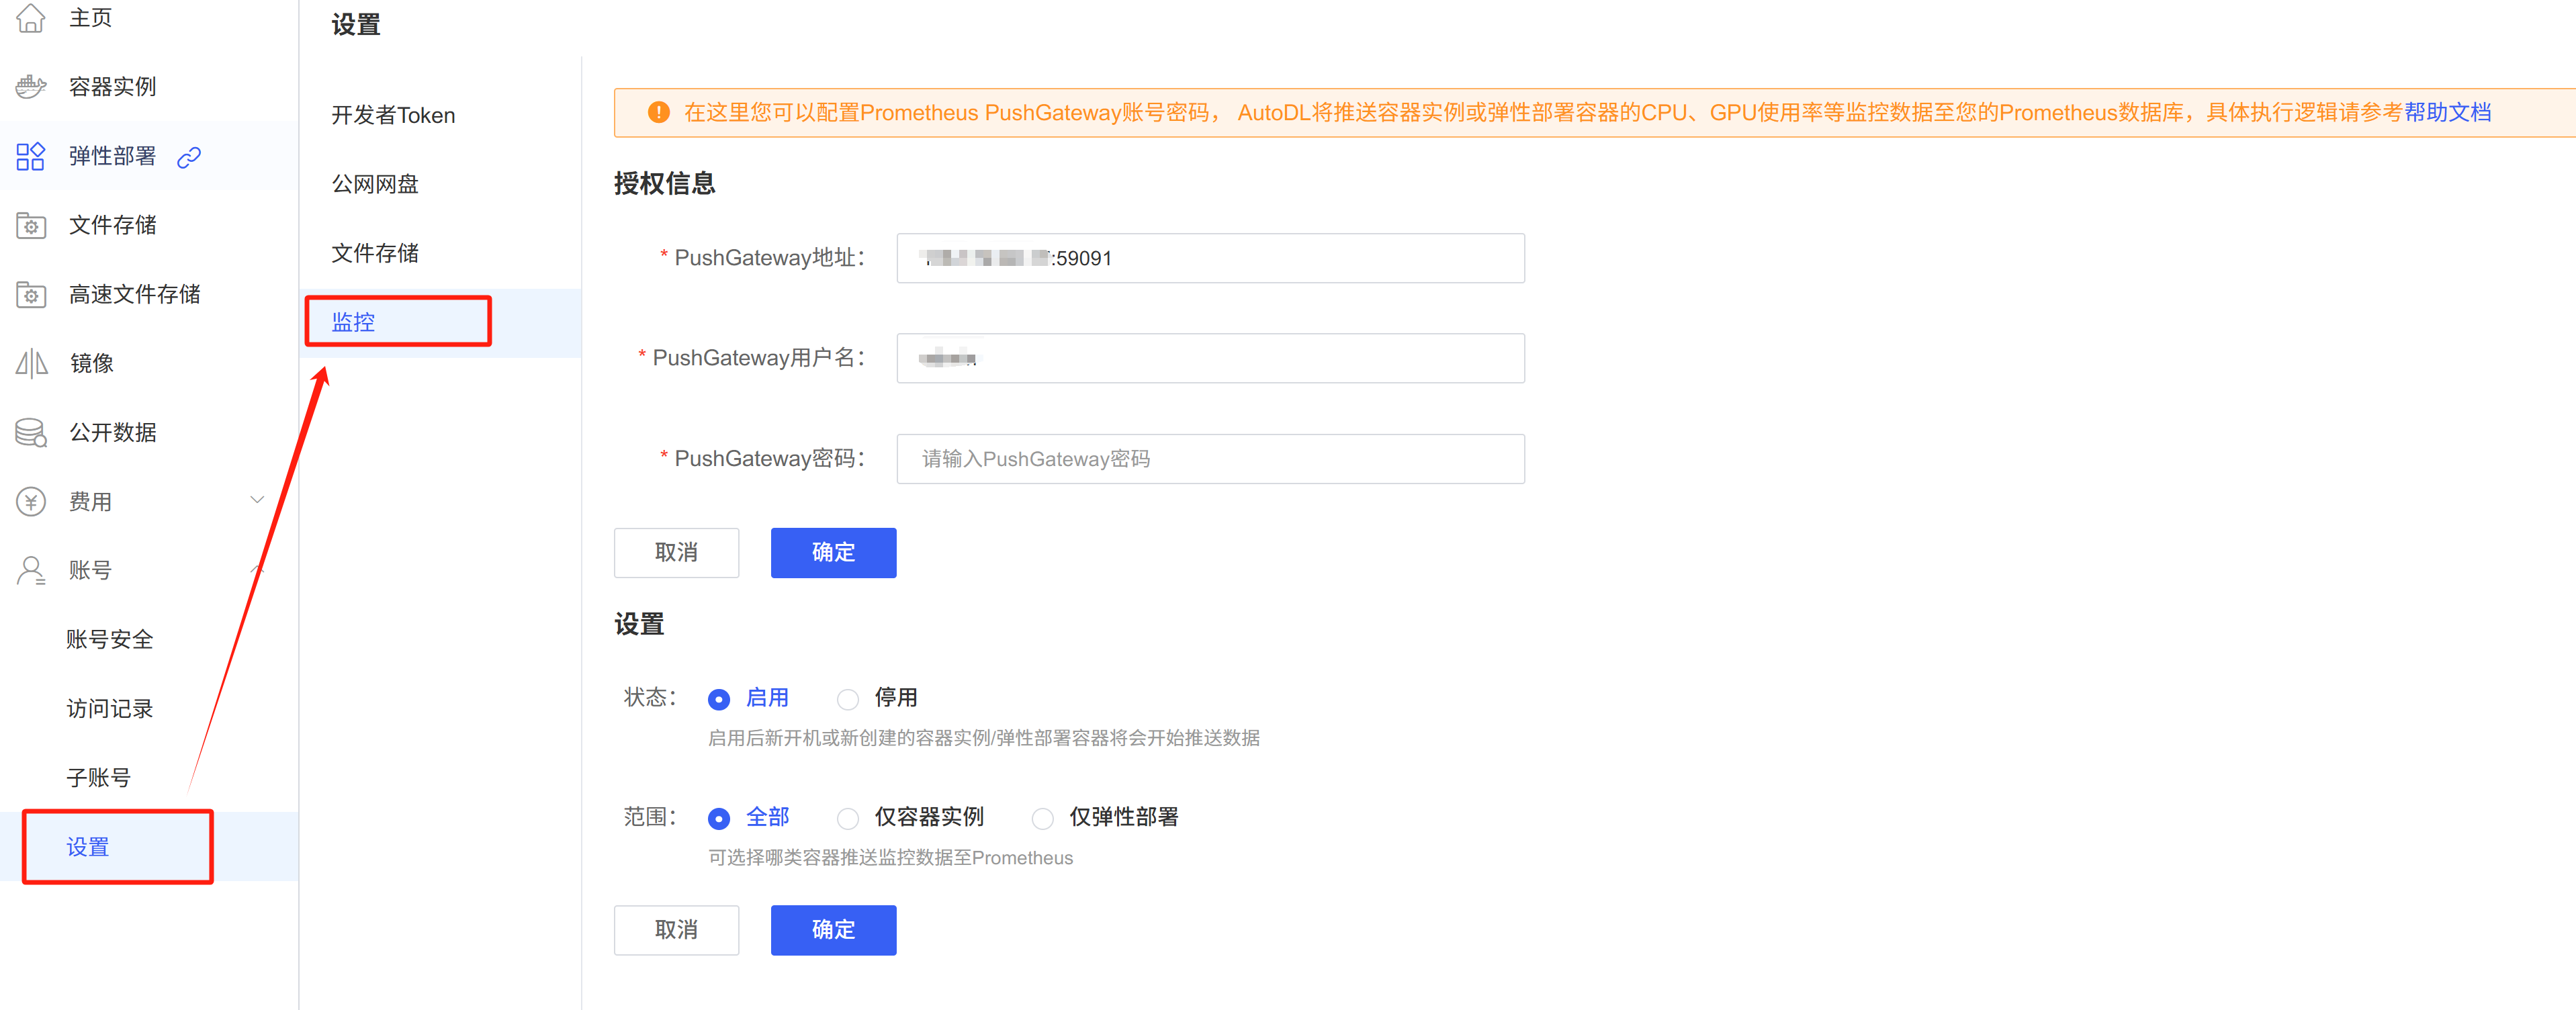
Once enabled, newly created or restarted containers will begin pushing metric data.
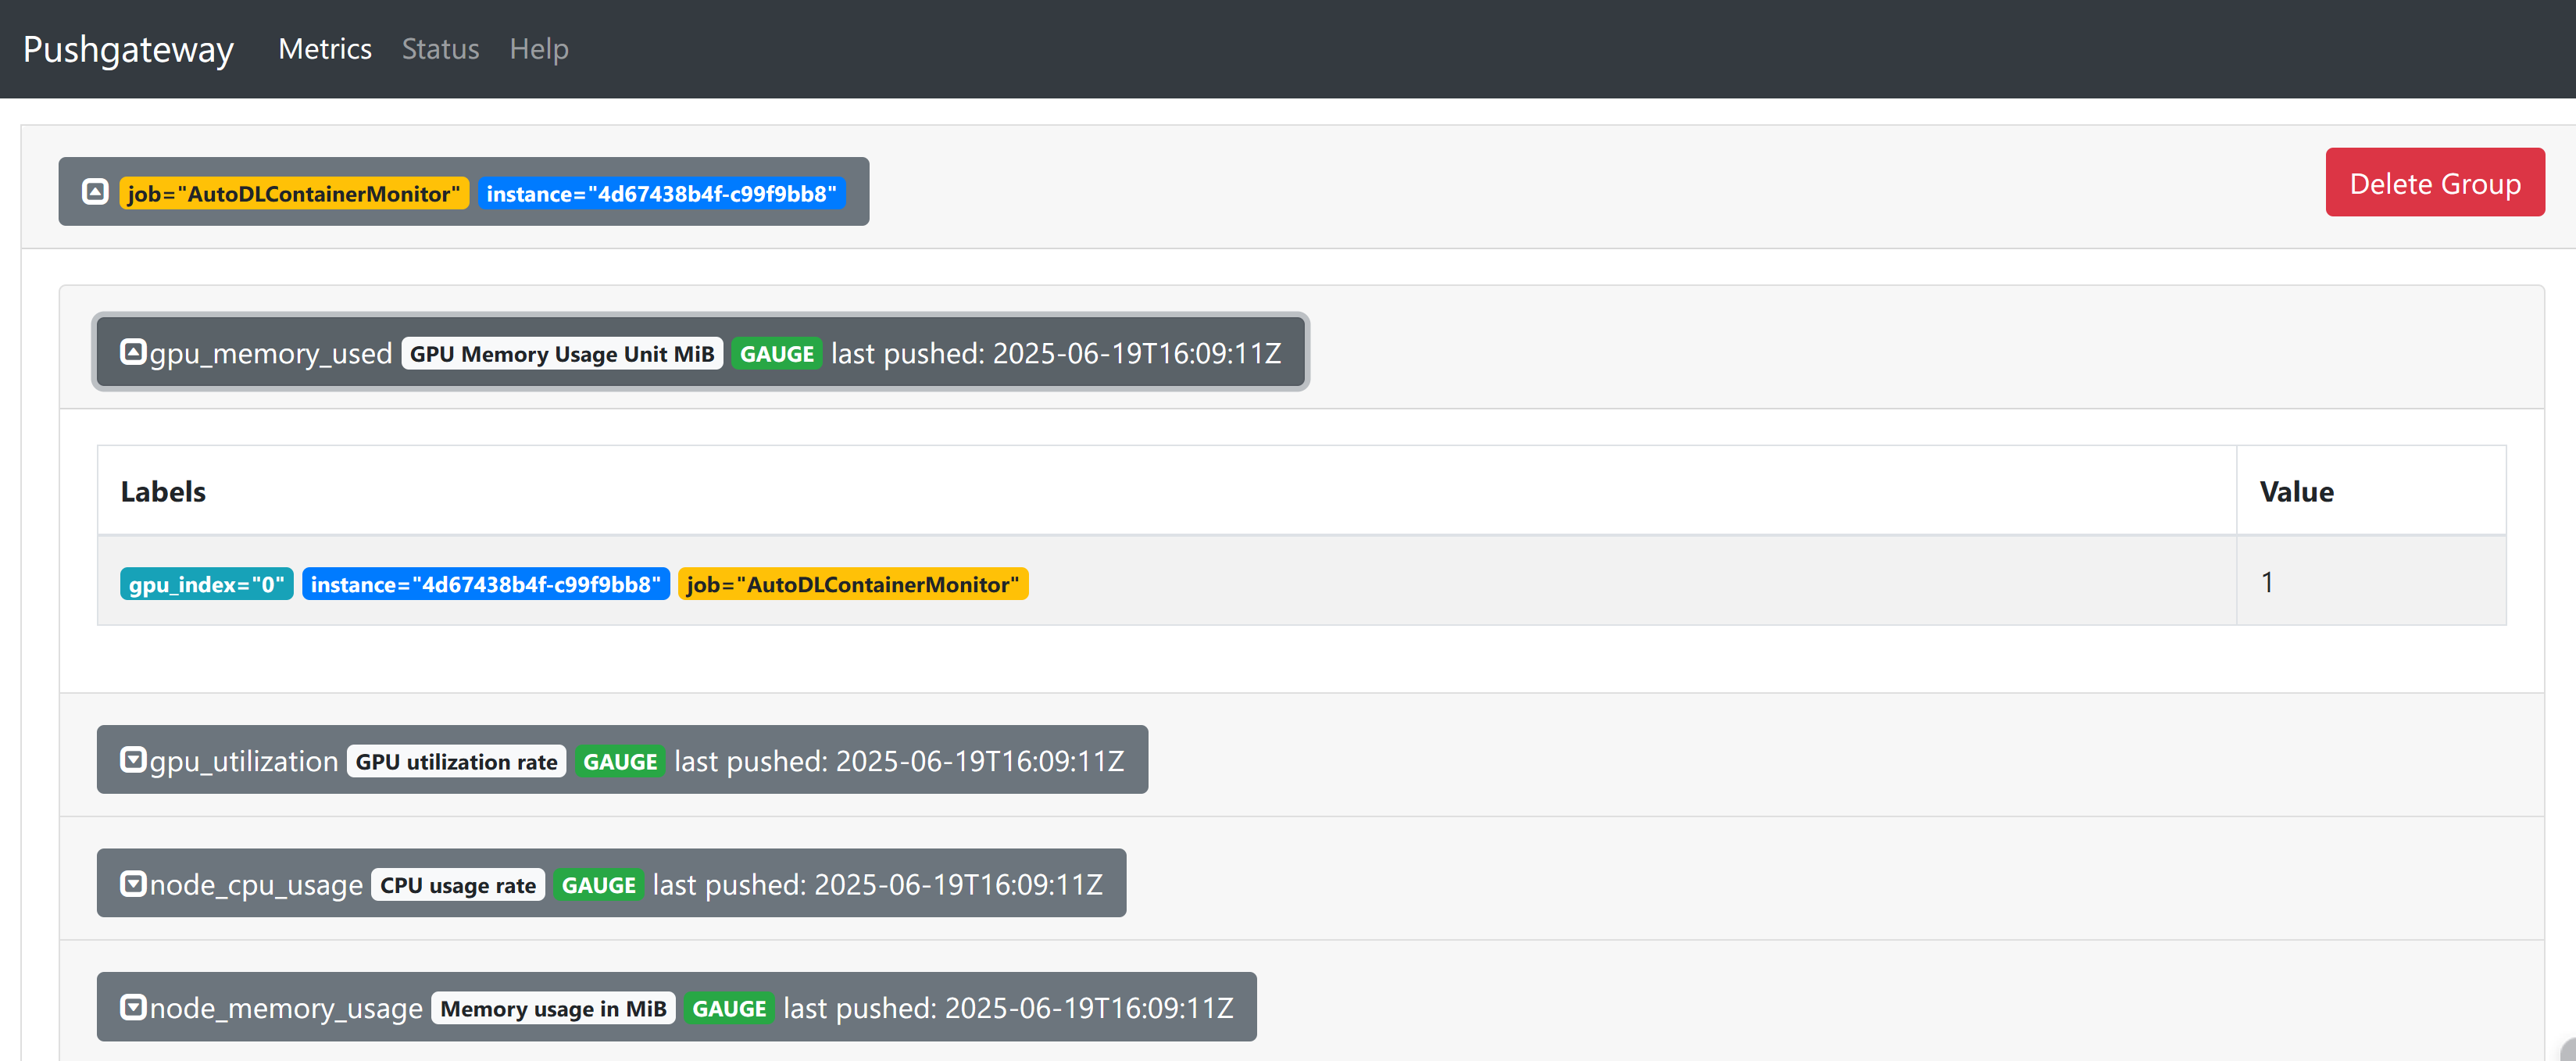
To visualize this metric data, please use Grafana or similar tools for further configuration.