
WebCal
Ctrl K

मार्गदर्शिका

Performance Metrics Monitoring

मार्गदर्शिकाएकीकरणसामान्य प्रश्नसहायता
मूल्यब्लॉग
त्वरित प्रारंभTop-Up and BillingAccelerating Access to Academic ResourcesQuick StartIntroductionMaintenance and TroubleshootingNetwork
प्लेटफ़ॉर्मJetBrain ProjectorTmpWebCal Scholars Program @2026Introduction to the Public Beta/Suqian Zone AAbout UsCopying Data Between InstancesAnalysis of Server Performance MetricsTidal Computing PowerLoad Balancing
घरेलू चिप्सUsing Huawei MindIEHuawei Ascend NPUMooreThread GPU
परिवेश सेटअपCUDA/cuDNNMinicondaPython3.XInstalling DependenciesOverviewImages
एंटरप्राइज़ सुविधाएँFlexible DeploymentElastic Deployment Release NotesBest Practices for Elastic DeploymentPerformance Metrics Monitoring
कंटेनर इंस्टेंसJupyterLabRemote SSH ConnectionSave the imageScaling ConfigurationMulti-machine, multi-GPU parallel processingDaemonOverviewChange the billing methodMigration Example (Same Region)Migration ExamplesRemote DesktopReset the system
GPU चुननाGPU SelectionPerformance Testing
डेटाUpload DataDownload DataPublic DataPublic Cloud Storage (Highly Recommended)Compression / DecompressionFile StorageLocal data diskOverview
सर्वोत्तम अभ्यासFileZillaGitGromacsHuggingFaceKataGoLinux BasicsMPIOpenCLPyCharm Remote DevelopmentR (RStudio) InstallationSSH TunnelTensorBoardRemote Development with VSCodeVisdomVulkanXShellOpen PortsWeChat MessagesPerformanceExpose multiple servicesMoney-Saving TipsComputation Precision IssuesSoftware Sources

एंटरप्राइज़ सुविधाएँ

Performance Metrics Monitoring

30/07/202682092 व्यू

Available only to enterprise-verified accounts

Method 1: Proactively Retrieve the API from Within the Container

Use the following code to retrieve CPU, memory, and GPU monitoring information within a container (either a container instance or a container in an elastic deployment):

import requests
import json

# url地址不同容器都一样,均使用127.0.0.1进行获取
url = 'http://127.0.0.1:2022/autopanel/v1/api/monitor/current'
response = requests.get(url)
content = response.content.decode()
if response.status_code == 200 and "success" in content:
    metric = json.loads(content)['data']
    print(f"CPU Usage: {metric['cpu_usage']} %")
    print(f"Mem Usage: {metric['memory_usage']} MiB")
    print("GPU Info:")
    gpu_metrics = metric.get('gpu_list', [])
    for gm in gpu_metrics:
        print(f"\tIdx:{gm['index']}  Mem Usage: {gm['memory_used']} MiB  Utilization: {gm['utilization']} %")

Method 2: Push to Prometheus

You can configure the PushGateway username and password for your own hosted Prometheus instance on WebCal. WebCal will automatically push container metric data to your private Prometheus database, allowing you to view monitoring data for all containers using other tools such as Grafana.Note: You are responsible for providing Prometheus, PushGateway, Grafana, and other components yourself; WebCal only pushes the data.

Configure and enable the push of monitoring data to Prometheus
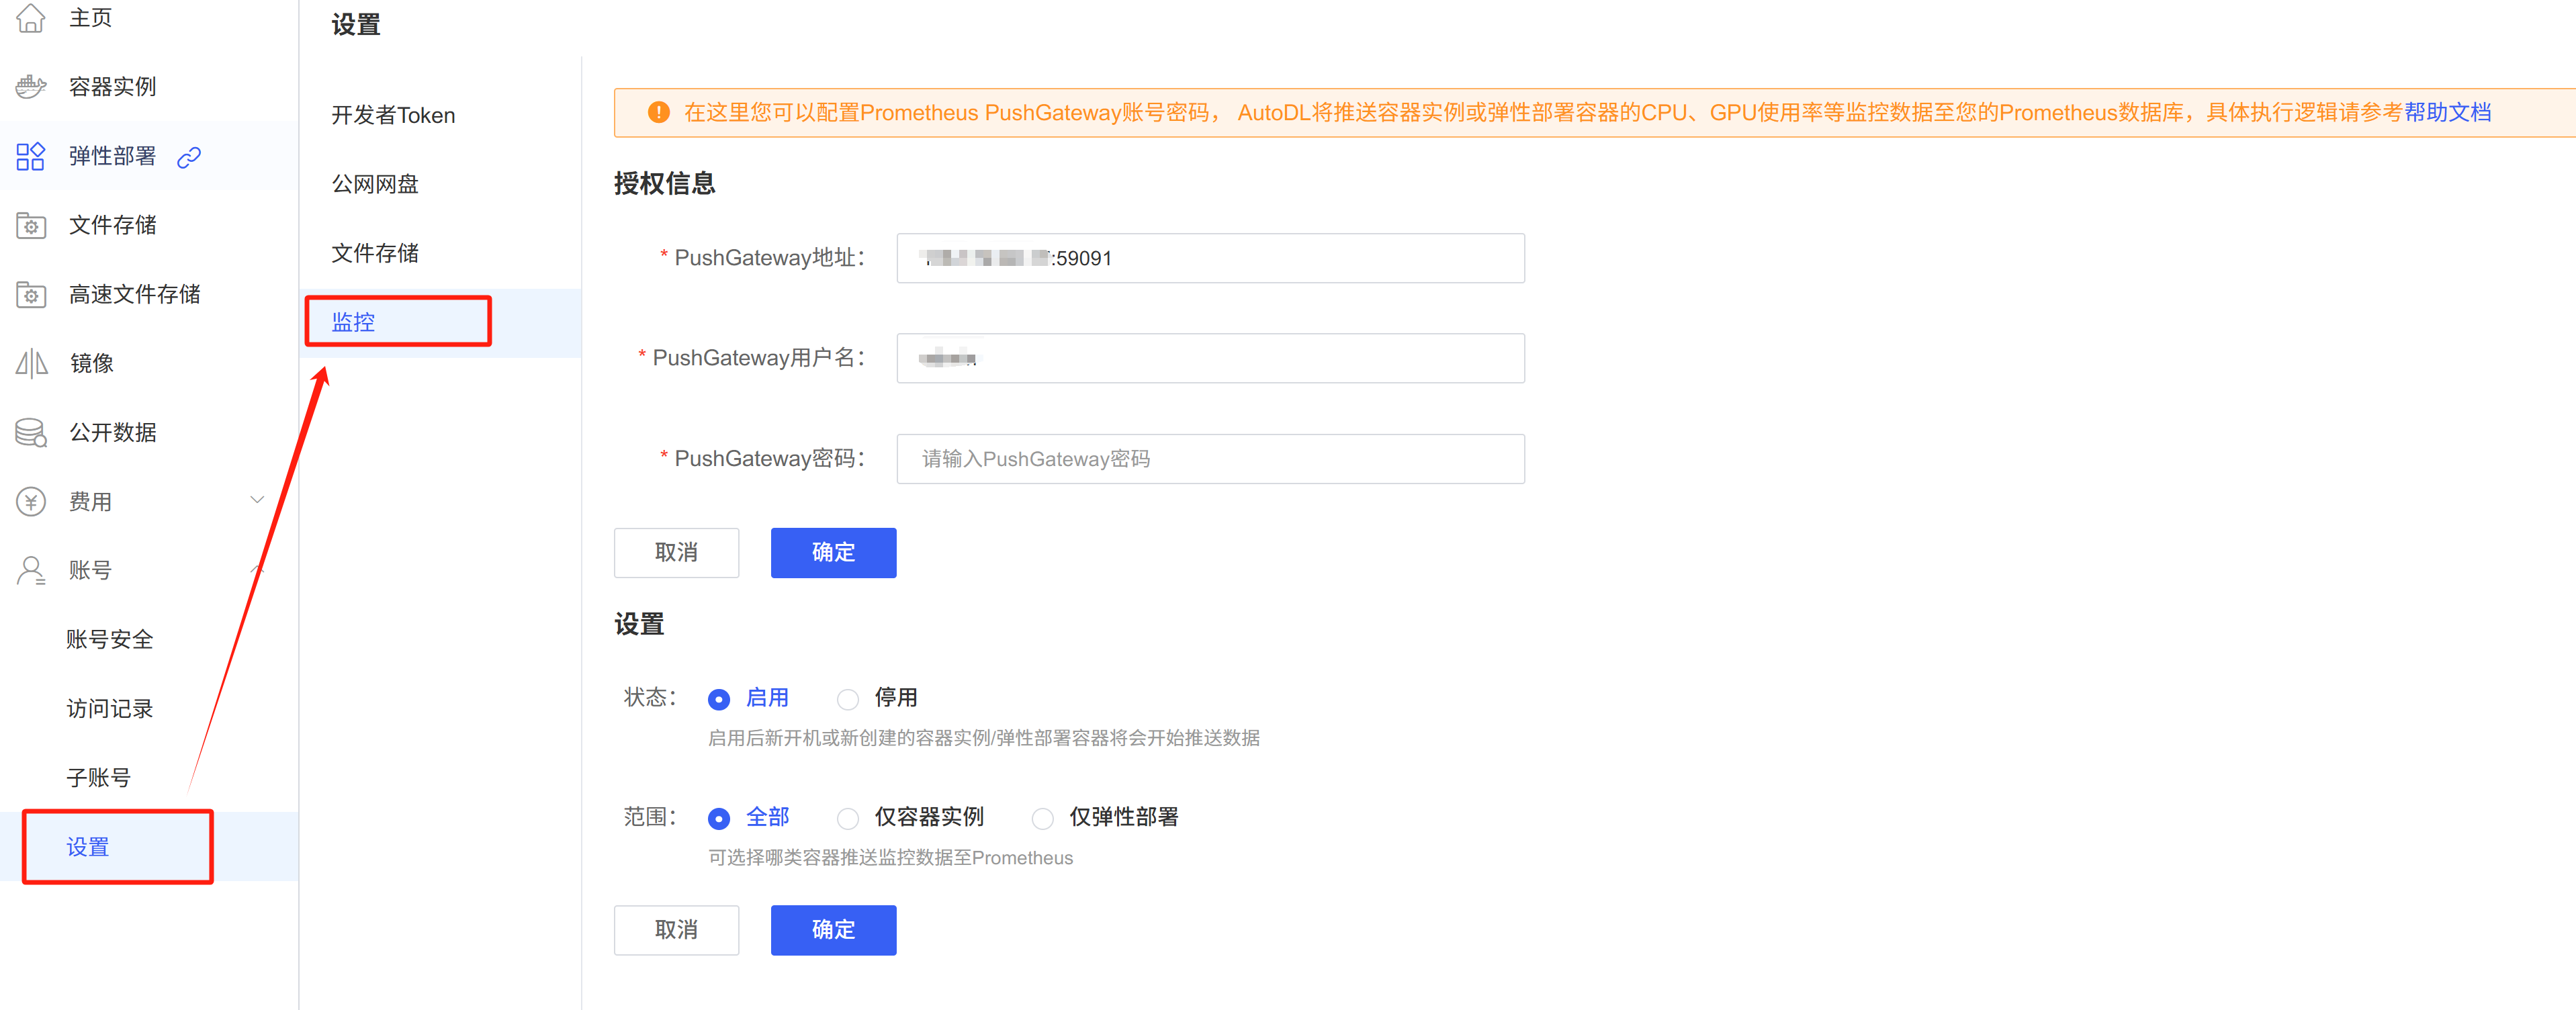
Once enabled, newly created or restarted containers will begin pushing metric data.
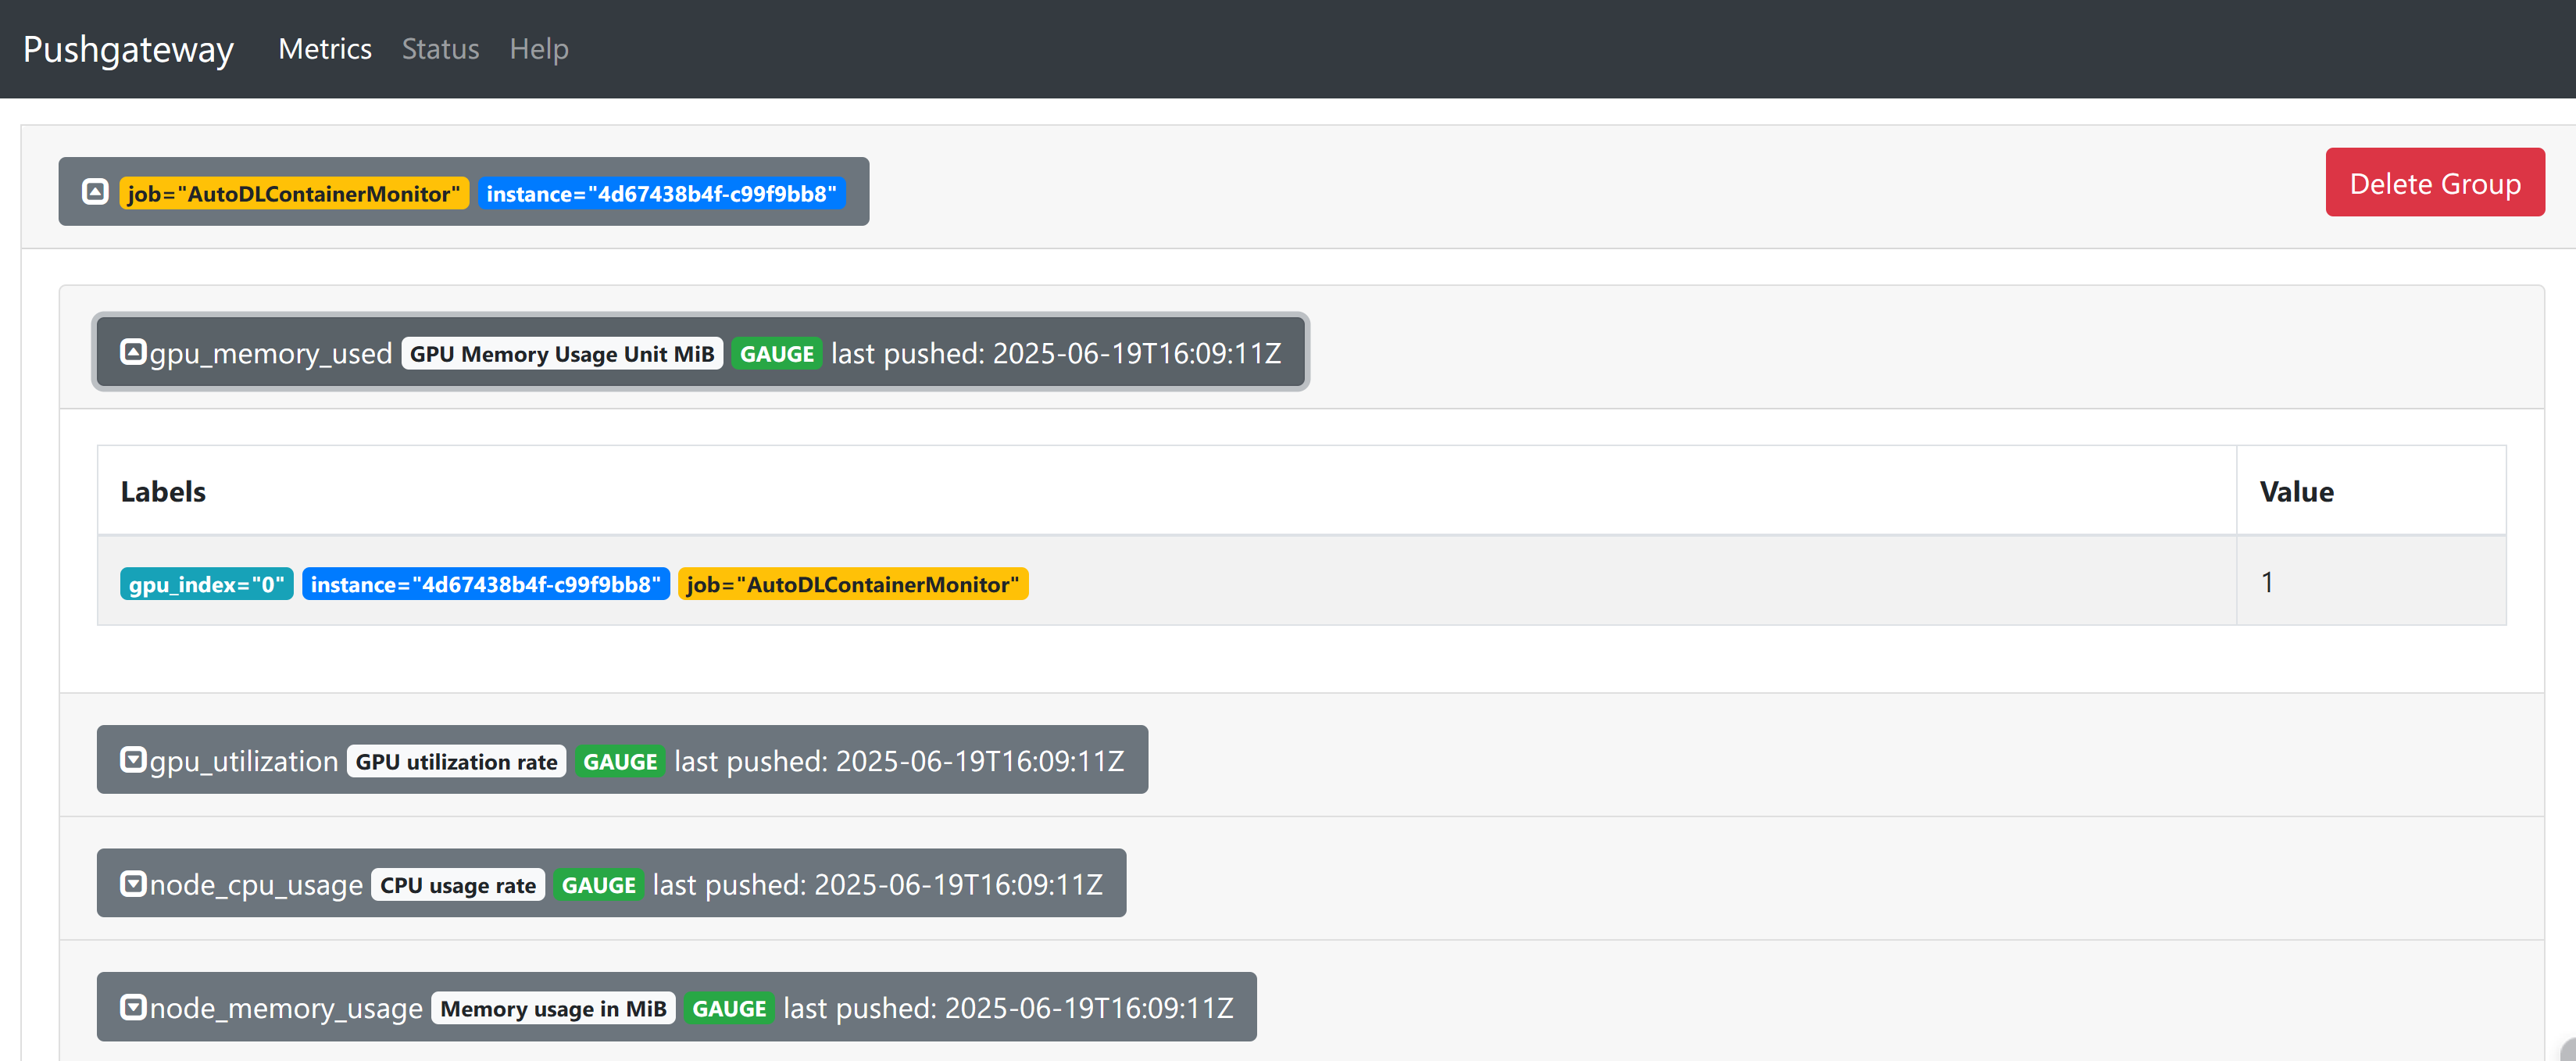
To visualize this metric data, please use Grafana or similar tools for further configuration.

अगला लेखIntroduction to the Public Beta/Suqian Zone A
Compute Rental दस्तावेज़मार्गदर्शिका पर वापस जाएं